Progranulin, also known as acrogranin, PC cell-derived growth factor (PCDGF) and epithelin/granulin precursor, is a ubiquitously expressed, 88 kDa, secreted glycoprotein (1‑3). Structurally, it does not belong to any of the well-established growth factor families (4). Human Progranulin is 593 amino acids (aa) in length and contains a 17 aa signal sequence and 5 potential sites for N-linked glycosylation (Swiss Prot # P28799). It has a highly repetitive organization, containing seven tandem copies of a 55-57 aa consensus motif that contains 12 conserved cysteine residues: VXCX5-6CX5CCX8CCX6CCXDX2HCCPX4CX5-6CX2 (1). There is one alternate splice form for human Progranulin. This has a deletion of aa corresponding to aa 377-531 of the standard form. Progranulin is secreted as a full length form (2, 4), and may undergo proteolysis leading to the release of numerous peptides made from the seven tandem repeats, called the granulins (5-7). Human Progranulin shares 75% aa sequence identity with mouse and rat Progranulin. Progranulin is involved in the regulation of cellular proliferation, as well as differentiation, development, and pathological processes (4). It has been isolated as a differentially expressed gene during mesothelial differentiation (8), macrophage development (9), the development of rheumatoid arthritis and osteoarthritis (10), sexual differentiation of the brain (11), and has also been shown to be a mediator of cartilage proliferation and of wound response and tissue repair (4, 12 13). High levels of Progranulin expression have been found to be associated with several human cancers and are believed to contribute to tumorigenesis in breast cancer, clear cell renal carcinoma, invasive ovarian carcinoma, glioblastoma, adipocyte teratoma, and multiple myeloma (4-5, 12, 14-19). In addition, mutations in the Progranulin gene are a cause of frontotemporal dementia, and increased expression of Progranulin is seen in activated microglia in many neurodegenerative diseases including Creutzfeldt-Jakob disease, motor neuron disease and Alzheimer's disease (20). Mutations in Progranulin causing neurodegenerative disease indicate that Progranulin is important for neuronal survival (20).

Key Product Details
Validated by
Species Reactivity
Validated:
Cited:
Applications
Validated:
Cited:
Label
Antibody Source
Product Specifications
Immunogen
Thr18-Leu593
Accession # P28799
Specificity
Clonality
Host
Isotype
Scientific Data Images for Human Progranulin/PGRN Antibody
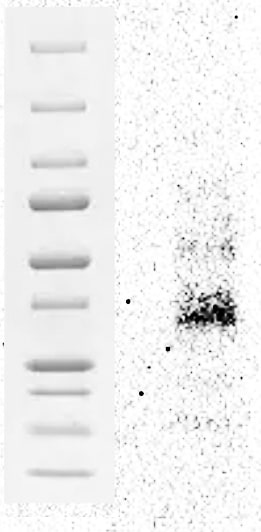
Detection of Human Progranulin/PGRN by Western Blot.
Western blot shows lysates of HepG2 human hepatocellular carcinoma cell line. PVDF membrane was probed with 1 µg/mL of Goat Anti-Human Progranulin/PGRN Antigen Affinity-purified Polyclonal Antibody (Catalog # AF2420) followed by HRP-conjugated Anti-Goat IgG Secondary Antibody (HAF019). A specific band was detected for Progranulin/PGRN at approximately 80 kDa (as indicated). This experiment was conducted under reducing conditions and using Immunoblot Buffer Group 1.

Progranulin in Human Breast Cancer Tissue.
Progranulin was detected in paraffin-embedded sections of human breast cancer tissue using Goat Anti-Human Progranulin Antigen Affinity-purified Polyclonal Antibody (Catalog # AF2420) at 1.7 µg/mL overnight at 4 °C. Tissue was stained using the Anti-Goat HRP-DAB Cell & Tissue Staining Kit (brown; CTS008) and counterstained with hematoxylin (blue). View our protocol for Chromogenic IHC Staining of Paraffin-embedded Tissue Sections.

Western Blot Shows Human Progranulin/PGRN Specificity by Using Knockout Cell Line.
Western blot shows lysates of HEK293T human embryonic kidney parental cell line and Progranulin knockout HEK293T cell line (KO). PVDF membrane was probed with 1 µg/mL of Goat Anti-Human Progranulin/PGRN Antigen Affinity-purified Polyclonal Antibody (Catalog # AF2420) followed by HRP-conjugated Anti-Goat IgG Secondary Antibody (HAF017). A specific band was detected for Progranulin/PGRN at approximately 80 kDa (as indicated) in the parental HEK293T cell line, but is not detectable in knockout HEK293T cell line. GAPDH (AF5718) is shown as a loading control. This experiment was conducted under reducing conditions and using Immunoblot Buffer Group 1.

Detection of Human Progranulin/PGRN by Knockout Validated
GRN levels are regulated by SORT1 and TMEM106B expression. A, HAP1 PGRN KO cells were treated with C-TAP PGRN or N-TAP PGRN (5 µg/ml) for 24 h and lysates were analyzed for PGRN and GRN-2,3 by immunoblot. B, HAP1 WT, SORT1 KO, and PGRN KO cell lysates were analyzed for endogenous levels of SORT1, PGRN, and GRN-2,3 by immunoblot. C, D, Quantification of (C) PGRN and (D) GRN-2,3 from the experiment in B. E, Overexpression of TMEM106B in HeLa cells for 48-h results in the formation of large vacuoles. Scale bar, 20 µm. F, HeLa cells were transfected with empty vector or TMEM106B for 48 h and lysates were analyzed for PGRN and GRN-2,3 by immunoblot. G-I, Quantification of (G) intracellular PGRN, (H) intracellular GRN-2,3, and (I) secreted PGRN (by ELISA) from the experiment in F. Arrow in F denotes endogenous, intermediate PGRN cleavage product. J, Overexpression of TMEM106B for 24 h in HAP1 PGRN KO cells results in the formation of large vacuoles. Scale bar, 10 µm. K, HAP1 PGRN KO cells were transfected with TMEM106B for 24 h and then treated with mCherry-PGRN (5 µg/ml) for an additional 24 h. Lysates were analyzed for PGRN and GRN-2,3 by immunoblot. L, M, Quantification of (L) PGRN and (M) GRN-2,3 from the experiment in K. For all immunoblots, PGRN and GRN-2,3 were detected with R&D AF2420 and Sigma antibodies, respectively. All immunoblot images are representative of at least three independent experiments and quantitative data are presented as mean ± SEM of three independent experiments; *differs from control p < 0.05; **p < 0.01; ***p < 0.001; ns = not significant. Image collected and cropped by CiteAb from the following publication (https://pubmed.ncbi.nlm.nih.gov/28828399), licensed under a CC-BY license. Not internally tested by R&D Systems.
Detection of Human Progranulin/PGRN by Immunohistochemistry
Progranulin Interactions with AD pathological Features. (a-c). Representative photomicrographs of progranulin (PGRN)(purple) immunoreactivity associated with amyloid beta (A beta ) plaques (brown) in MTG sections of low plaque, high plaque and Alzheimer’s disease cases. Scale bar represents 30 μm. (d-f). Photomicrographs of PGRN (purple) immunoreactivity associated with CD45 immunoreactive microglia in MTG sections of low plaque (d), high plaque (e), and Alzheimer’s disease cases (f). Insets a) show at higher magnification PGRN-positive stained neurons present in each section. Neurons are identified by their size and characteristic shape. Insets b) show higher magnification of PGRN-positive microglia. Scale bar represents 20 μm (d-f), and 10 μm for insets. (g-i). Photomicrographs of PGRN (purple) with plaque-associated CD45-positive microglia (brown). Progressive increase in accumulation of CD45-positive microglia in low plaque (g), high plaque (h) and Alzheimer’s disease (i) cases. Scale bar represents 30 μm. (j-o). Absence of PGRN immunoreactivity of neurofibrillary tangles. (j-i) Photomicrographs of PGRN (purple) and phosphorylated tau (AT8)(brown) double-stained sections from low plaque (j), high-plaque (k), and Alzheimer’s disease cases (l). (m-o). Confocal micrographs of PGRN (green) and phosphorylated tau (AT180)-positive tangles in low-plaque (m), high-plaque (n) and Alzheimer’s disease (o) cases. Scale bar represents 10 μm. Image collected and cropped by CiteAb from the following publication (https://pubmed.ncbi.nlm.nih.gov/31864418), licensed under a CC-BY license. Not internally tested by R&D Systems.
Detection of Human Progranulin/PGRN by Western Blot
Hypoglycosylation of proteins in knockout HEK293 cell lines.Cell lines were transfected with expression vectors for the following human glycoproteins: (a) SHBG, (b) SHBG derivatives (see diagram) with single glycosylation sites (SHBG N380Q and N396Q), (c) a cathepsin C derivative with a single glycosylation site (CatC delta 234-HA), (d) prosaposin (pSAP-DDKHis), (e) haptoglobin (Hp-DDKHis), (f) hemopexin (Hpx-DDKHis). Endogenous progranulin (pGran) (d) was analyzed using non-transfected cells. The cells were pulse labeled for 10 min and chased for 10 min (pSAP, pGran and CatC delta 234-HA) or pulse labeled for 5 min and chased for 20 min (Hp, SHBG and Hpx). Glycoproteins precipitated with anti-DDK, anti-HA or anti-SHBG were resolved by PAGE in SDS. EH designates treatment with endoglycosidase H. Quantified values below gel lanes (a–f) are for the displayed image, which is representative of two or more experiments. (b) The vertical line indicates the excision of three intervening gel lanes. (d) Resolution of pGran glycoforms is not sufficient for quantification. Nonglycosylated forms of pSAP, Hp, and Hpx that comigrate with the EH-digested form of the substrate in HEK293 cells correspond to a non-translocated precursor and were not used to calculate the average number of glycans. (a–f) Phosphorimages were cropped to display the region of interest. Full-length phosphorimages are shown in Supplemental Fig. S5. Image collected and cropped by CiteAb from the following publication (https://pubmed.ncbi.nlm.nih.gov/26864433), licensed under a CC-BY license. Not internally tested by R&D Systems.
Detection of Human Progranulin/PGRN by Immunocytochemistry/Immunofluorescence
Confocal microscopy of prosaposin localization on plaques and different cell types. (a-c). A beta (green) (a) and PSAP (red) plaque (b) with limited colocalization (C – yellow) in an AD case. Scale bar represents 30 μm. (d-f). Comparison of colocalization in plaque of PGRN (green) and A beta (blue) (d) with PSAP (red) and A beta (blue) in triple-stained AD section. Merged images show extensive colocalization of PGRN and PSAP (yellow) but limited overlap with A beta -positive structures. Scale bar represents 30 μm. (G-I). Merged images of PSAP (red) immunoreactivity with microglial markers IBA-1 (g) and CD68 (h) (green) and astrocyte marker GFAP (green) show some expression of PSAP in both cell types (yellow). These images show that PSAP (red) is predominantly in cells with morphology of neurons. Scale bar represents 10 μm. (j-l). Merged images of CD68 (green) and PSAP (red) on plaques in low plaque case (J), high plaque case (k) and AD case (l). Significant amounts of PSAP immunoreactivity (red) can be observed on all plaques but with only limited colocalization with CD68 in infiltrating microglia. Scale bar represents 30 μm. (m-n) Merged images of AT180 (pTau) (green) and PSAP (red) on tangle in low plaque case (M), high plaque case (n) and Alzheimer’s disease case (o). Very limited amounts of PSAP immunoreactivity (yellow) can be observed on tangles. Panel M and N show intracellular tangles with DAPI-positive nuclei, while panel O shows extracellular tangle. Scale bar represents 30 μm. Image collected and cropped by CiteAb from the following publication (https://pubmed.ncbi.nlm.nih.gov/31864418), licensed under a CC-BY license. Not internally tested by R&D Systems.
Detection of Human Progranulin/PGRN by Immunohistochemistry
Progranulin Interactions with AD pathological Features. (a-c). Representative photomicrographs of progranulin (PGRN)(purple) immunoreactivity associated with amyloid beta (A beta ) plaques (brown) in MTG sections of low plaque, high plaque and Alzheimer’s disease cases. Scale bar represents 30 μm. (d-f). Photomicrographs of PGRN (purple) immunoreactivity associated with CD45 immunoreactive microglia in MTG sections of low plaque (d), high plaque (e), and Alzheimer’s disease cases (f). Insets a) show at higher magnification PGRN-positive stained neurons present in each section. Neurons are identified by their size and characteristic shape. Insets b) show higher magnification of PGRN-positive microglia. Scale bar represents 20 μm (d-f), and 10 μm for insets. (g-i). Photomicrographs of PGRN (purple) with plaque-associated CD45-positive microglia (brown). Progressive increase in accumulation of CD45-positive microglia in low plaque (g), high plaque (h) and Alzheimer’s disease (i) cases. Scale bar represents 30 μm. (j-o). Absence of PGRN immunoreactivity of neurofibrillary tangles. (j-i) Photomicrographs of PGRN (purple) and phosphorylated tau (AT8)(brown) double-stained sections from low plaque (j), high-plaque (k), and Alzheimer’s disease cases (l). (m-o). Confocal micrographs of PGRN (green) and phosphorylated tau (AT180)-positive tangles in low-plaque (m), high-plaque (n) and Alzheimer’s disease (o) cases. Scale bar represents 10 μm. Image collected and cropped by CiteAb from the following publication (https://pubmed.ncbi.nlm.nih.gov/31864418), licensed under a CC-BY license. Not internally tested by R&D Systems.
Detection of Human Progranulin/PGRN by Western Blot
Biochemical analysis of interactions of progranulin and prosaposin in MTG brain samples. (a-b). Co-immunoprecipitation of Progranulin and Prosaposin. a). Western blot control analyses to show interactions of progranulin (PGRN) and prosaposin (PSAP). Immunoprecipitation of PGRN-overexpressing HEK (HEK and HEK1) cells and AD brain sample with protein G- (goat antibody) or protein A- (rabbit antibody) antibody-conjugated magnetic beads. Beads were prepared using non-immune goat IgG, goat anti-PGRN and rabbit anti-PSAP. Immunoprecipitated samples were separated by gel electrophoresis, transferred to membranes, and probed with antibodies to PSAP and PGRN. Samples of total protein (non-immunoprecipitated) from PGRN-overexpressing HEK (HEK) cells and brain sample (AD) were analyzed as specificity controls. Samples immunoprecipitated with PGRN antibody contained PSAP, and samples precipitated with PSAP antibody contained PGRN. b). All of the brain samples from LP, AD and HP cases precipitated with PGRN antibody pulled-down PSAP. A series of cases (n = 5) from each group were analyzed. Western blot images for both antibodies are shown. (c-f) Biochemical analysis of prosaposin in MTG brain protein extracts. c). Western blot analysis of total PSAP protein levels in MTG samples. Representative image of western blot demonstrating PSAP protein in samples from LP, HP and AD cases. The complete images of all samples analyzed for PSAP are shown as Additional file 4: Figure. S4B. D). Scatter plot showing expression levels of PSAP protein in the different groups. Results represent mean ±S.E.M. Significantly increased levels of PSAP protein were present in AD case compared to LP and HP cases but not between LP and HP cases. Significant increased levels of PSAP protein in MTG samples from AD compared to HP (* p < 0.05) and LP (** p < 0.01). e). Positive correlation between PSAP and PGRN protein levels in MTG samples (Pearson r = 0.4674, p = 0.0070). f). Positive correlation between PSAP and A beta protein levels in MTG samples (Pearson r = 0.4584, p = 0.0083). Image collected and cropped by CiteAb from the following publication (https://pubmed.ncbi.nlm.nih.gov/31864418), licensed under a CC-BY license. Not internally tested by R&D Systems.
Detection of Human Progranulin/PGRN by Immunohistochemistry
Progranulin Interactions with AD pathological Features. (a-c). Representative photomicrographs of progranulin (PGRN)(purple) immunoreactivity associated with amyloid beta (A beta ) plaques (brown) in MTG sections of low plaque, high plaque and Alzheimer’s disease cases. Scale bar represents 30 μm. (d-f). Photomicrographs of PGRN (purple) immunoreactivity associated with CD45 immunoreactive microglia in MTG sections of low plaque (d), high plaque (e), and Alzheimer’s disease cases (f). Insets a) show at higher magnification PGRN-positive stained neurons present in each section. Neurons are identified by their size and characteristic shape. Insets b) show higher magnification of PGRN-positive microglia. Scale bar represents 20 μm (d-f), and 10 μm for insets. (g-i). Photomicrographs of PGRN (purple) with plaque-associated CD45-positive microglia (brown). Progressive increase in accumulation of CD45-positive microglia in low plaque (g), high plaque (h) and Alzheimer’s disease (i) cases. Scale bar represents 30 μm. (j-o). Absence of PGRN immunoreactivity of neurofibrillary tangles. (j-i) Photomicrographs of PGRN (purple) and phosphorylated tau (AT8)(brown) double-stained sections from low plaque (j), high-plaque (k), and Alzheimer’s disease cases (l). (m-o). Confocal micrographs of PGRN (green) and phosphorylated tau (AT180)-positive tangles in low-plaque (m), high-plaque (n) and Alzheimer’s disease (o) cases. Scale bar represents 10 μm. Image collected and cropped by CiteAb from the following publication (https://pubmed.ncbi.nlm.nih.gov/31864418), licensed under a CC-BY license. Not internally tested by R&D Systems.
Detection of Human Progranulin/PGRN by Western Blot
Biochemical analyses of Progranulin in MTG samples compared to A beta and phosphorylated tau. a). Scatter plot showing expression levels of PGRN protein in the different groups. Results presented represent the combination of levels of 75–80 kDa and lower molecular weight (55 kDa) PGRN protein bands. Results represent mean ±S.E.M. Significantly increased levels of PGRN protein were present in AD case compared to LP and HP cases but not between LP and HP cases (** p < 0.01, ns – not significant). b). Scatter plot showing expression levels of A beta protein in the different groups. Results presented represent the levels of all p-tau detected bands. Results represent mean ±S.E.M. Significantly increased levels of A beta (monomer) protein were present in AD case compared to LP and AD cases but not between LP and HP or HP and AD cases (** p < 0.01, ns – not significant). Outlier HP case indicated by red arrow (see text). c). Scatter plot showing expression levels of phosphorylated tau (p-tau – Thr 231) protein in the different disease groups. Results presented represent the levels of all p-tau detected bands. Results represent mean ±S.E.M. Significantly increased levels of p-tau protein were present in AD cases compared to LP and HP cases but not between LP and HP cases (* p < 0.05, ** p < 0.01, ns – not significant). d). Western blots showing bands detected with goat antibody to PGRN (PGRN) in MTG protein extracts from low plaque (LP), high plaque (HP) and AD cases. The complete series of samples are presented in Additional file 4: Fig. S4A). The same blots were reprobed with antibody AT180 to phosphorylated tau (pTau), and beta -actin for normalization purposes. e). Western blots showing bands detected with antibody 6E10 to A beta in MTG protein extracts from low plaque (LP), high plaque (HP) and AD cases. Results represent mean ±S.E.M. Samples were separate from those in panel A by using Tris-tricine gels to resolve low molecular weight bands. f). Correlation Analyses between PGRN protein and A beta protein levels for all samples. Significant correlation (r = 0.5422, p = 0.0013). g). Correlation Analyses between PGRN protein and p-tau (Thr231) protein levels for all samples. Significant correlation (r = 0.5264, p = 0.002). Image collected and cropped by CiteAb from the following publication (https://pubmed.ncbi.nlm.nih.gov/31864418), licensed under a CC-BY license. Not internally tested by R&D Systems.
Detection of Human Progranulin/PGRN by Western Blot
Biochemical analysis of interactions of progranulin and prosaposin in MTG brain samples. (a-b). Co-immunoprecipitation of Progranulin and Prosaposin. a). Western blot control analyses to show interactions of progranulin (PGRN) and prosaposin (PSAP). Immunoprecipitation of PGRN-overexpressing HEK (HEK and HEK1) cells and AD brain sample with protein G- (goat antibody) or protein A- (rabbit antibody) antibody-conjugated magnetic beads. Beads were prepared using non-immune goat IgG, goat anti-PGRN and rabbit anti-PSAP. Immunoprecipitated samples were separated by gel electrophoresis, transferred to membranes, and probed with antibodies to PSAP and PGRN. Samples of total protein (non-immunoprecipitated) from PGRN-overexpressing HEK (HEK) cells and brain sample (AD) were analyzed as specificity controls. Samples immunoprecipitated with PGRN antibody contained PSAP, and samples precipitated with PSAP antibody contained PGRN. b). All of the brain samples from LP, AD and HP cases precipitated with PGRN antibody pulled-down PSAP. A series of cases (n = 5) from each group were analyzed. Western blot images for both antibodies are shown. (c-f) Biochemical analysis of prosaposin in MTG brain protein extracts. c). Western blot analysis of total PSAP protein levels in MTG samples. Representative image of western blot demonstrating PSAP protein in samples from LP, HP and AD cases. The complete images of all samples analyzed for PSAP are shown as Additional file 4: Figure. S4B. D). Scatter plot showing expression levels of PSAP protein in the different groups. Results represent mean ±S.E.M. Significantly increased levels of PSAP protein were present in AD case compared to LP and HP cases but not between LP and HP cases. Significant increased levels of PSAP protein in MTG samples from AD compared to HP (* p < 0.05) and LP (** p < 0.01). e). Positive correlation between PSAP and PGRN protein levels in MTG samples (Pearson r = 0.4674, p = 0.0070). f). Positive correlation between PSAP and A beta protein levels in MTG samples (Pearson r = 0.4584, p = 0.0083). Image collected and cropped by CiteAb from the following publication (https://pubmed.ncbi.nlm.nih.gov/31864418), licensed under a CC-BY license. Not internally tested by R&D Systems.
Detection of Human Progranulin/PGRN by Immunocytochemistry/Immunofluorescence
Progranulin Interactions with AD pathological Features. (a-c). Representative photomicrographs of progranulin (PGRN)(purple) immunoreactivity associated with amyloid beta (A beta ) plaques (brown) in MTG sections of low plaque, high plaque and Alzheimer’s disease cases. Scale bar represents 30 μm. (d-f). Photomicrographs of PGRN (purple) immunoreactivity associated with CD45 immunoreactive microglia in MTG sections of low plaque (d), high plaque (e), and Alzheimer’s disease cases (f). Insets a) show at higher magnification PGRN-positive stained neurons present in each section. Neurons are identified by their size and characteristic shape. Insets b) show higher magnification of PGRN-positive microglia. Scale bar represents 20 μm (d-f), and 10 μm for insets. (g-i). Photomicrographs of PGRN (purple) with plaque-associated CD45-positive microglia (brown). Progressive increase in accumulation of CD45-positive microglia in low plaque (g), high plaque (h) and Alzheimer’s disease (i) cases. Scale bar represents 30 μm. (j-o). Absence of PGRN immunoreactivity of neurofibrillary tangles. (j-i) Photomicrographs of PGRN (purple) and phosphorylated tau (AT8)(brown) double-stained sections from low plaque (j), high-plaque (k), and Alzheimer’s disease cases (l). (m-o). Confocal micrographs of PGRN (green) and phosphorylated tau (AT180)-positive tangles in low-plaque (m), high-plaque (n) and Alzheimer’s disease (o) cases. Scale bar represents 10 μm. Image collected and cropped by CiteAb from the following publication (https://pubmed.ncbi.nlm.nih.gov/31864418), licensed under a CC-BY license. Not internally tested by R&D Systems.
Detection of Human Progranulin/PGRN by Immunohistochemistry
Progranulin Interactions with AD pathological Features. (a-c). Representative photomicrographs of progranulin (PGRN)(purple) immunoreactivity associated with amyloid beta (A beta ) plaques (brown) in MTG sections of low plaque, high plaque and Alzheimer’s disease cases. Scale bar represents 30 μm. (d-f). Photomicrographs of PGRN (purple) immunoreactivity associated with CD45 immunoreactive microglia in MTG sections of low plaque (d), high plaque (e), and Alzheimer’s disease cases (f). Insets a) show at higher magnification PGRN-positive stained neurons present in each section. Neurons are identified by their size and characteristic shape. Insets b) show higher magnification of PGRN-positive microglia. Scale bar represents 20 μm (d-f), and 10 μm for insets. (g-i). Photomicrographs of PGRN (purple) with plaque-associated CD45-positive microglia (brown). Progressive increase in accumulation of CD45-positive microglia in low plaque (g), high plaque (h) and Alzheimer’s disease (i) cases. Scale bar represents 30 μm. (j-o). Absence of PGRN immunoreactivity of neurofibrillary tangles. (j-i) Photomicrographs of PGRN (purple) and phosphorylated tau (AT8)(brown) double-stained sections from low plaque (j), high-plaque (k), and Alzheimer’s disease cases (l). (m-o). Confocal micrographs of PGRN (green) and phosphorylated tau (AT180)-positive tangles in low-plaque (m), high-plaque (n) and Alzheimer’s disease (o) cases. Scale bar represents 10 μm. Image collected and cropped by CiteAb from the following publication (https://pubmed.ncbi.nlm.nih.gov/31864418), licensed under a CC-BY license. Not internally tested by R&D Systems.
Detection of Human Progranulin/PGRN by Western Blot
PGRN is an endogenous anti-HIV factor.Microglial PGRN was knocked down using RNAi 2–4 days prior to VSVg env HIV exposure as described in the Materials and Methods. Control cultures were treated with control, irrelevant siRNA (Ctr). The amounts of HIV (p24) and PGRN expression were determined by western blot analyses. (A) A representative western blot showing suppression of PGRN and increase of p24 following PGRN siRNA treatment. (B) Pooled densitometry data from four independent experiments showing significant inhibition of PGRN and increase of HIV (gag p24 express) in microglial cells treated with PGRN siRNA (vs. control siRNA). **P<0.01, ***P<0.001 by paired t-test. Image collected and cropped by CiteAb from the following publication (https://pubmed.ncbi.nlm.nih.gov/24878635), licensed under a CC-BY license. Not internally tested by R&D Systems.
Detection of Human Progranulin/PGRN by Immunohistochemistry
Progranulin Interactions with AD pathological Features. (a-c). Representative photomicrographs of progranulin (PGRN)(purple) immunoreactivity associated with amyloid beta (A beta ) plaques (brown) in MTG sections of low plaque, high plaque and Alzheimer’s disease cases. Scale bar represents 30 μm. (d-f). Photomicrographs of PGRN (purple) immunoreactivity associated with CD45 immunoreactive microglia in MTG sections of low plaque (d), high plaque (e), and Alzheimer’s disease cases (f). Insets a) show at higher magnification PGRN-positive stained neurons present in each section. Neurons are identified by their size and characteristic shape. Insets b) show higher magnification of PGRN-positive microglia. Scale bar represents 20 μm (d-f), and 10 μm for insets. (g-i). Photomicrographs of PGRN (purple) with plaque-associated CD45-positive microglia (brown). Progressive increase in accumulation of CD45-positive microglia in low plaque (g), high plaque (h) and Alzheimer’s disease (i) cases. Scale bar represents 30 μm. (j-o). Absence of PGRN immunoreactivity of neurofibrillary tangles. (j-i) Photomicrographs of PGRN (purple) and phosphorylated tau (AT8)(brown) double-stained sections from low plaque (j), high-plaque (k), and Alzheimer’s disease cases (l). (m-o). Confocal micrographs of PGRN (green) and phosphorylated tau (AT180)-positive tangles in low-plaque (m), high-plaque (n) and Alzheimer’s disease (o) cases. Scale bar represents 10 μm. Image collected and cropped by CiteAb from the following open publication (https://pubmed.ncbi.nlm.nih.gov/31864418), licensed under a CC-BY license. Not internally tested by R&D Systems.
Detection of Progranulin/PGRN by Western Blot
Crosslink between progranulin and IL-6 expression in breast cancer cell lines. Immunoblotting of IL-6, IL-8 and progranulin protein expression in MCF7 and MDA-MB-231 breast cancer cell lines. (a) Cells treated with increasing concentrations of progranulin showed an increase in IL-6 and IL-8 expression for 48 h. Treatment with an IL-6 (b) or IL-8 (c) concentration gradient led to an increased progranulin expression in MCF7 and MDA-MB-231 cells. SYPRO™ Ruby (Bio-Rad) stain was used as a loading control. Representative images from one of three independent experiments are shown. Western blot data are cut for visualization purposes, and all samples for the respective antibody were analyzed on the same blot. PGRN: progranulin, IL: interleukin. The uncropped bolts are shown in Supplementary Materials. Image collected and cropped by CiteAb from the following open publication (https://www.mdpi.com/2072-6694/15/24/5757), licensed under a CC-BY license. Not internally tested by R&D Systems.
Detection of Progranulin/PGRN by Western Blot
Crosslink between progranulin and IL-6 expression in breast cancer cell lines. Immunoblotting of IL-6, IL-8 and progranulin protein expression in MCF7 and MDA-MB-231 breast cancer cell lines. (a) Cells treated with increasing concentrations of progranulin showed an increase in IL-6 and IL-8 expression for 48 h. Treatment with an IL-6 (b) or IL-8 (c) concentration gradient led to an increased progranulin expression in MCF7 and MDA-MB-231 cells. SYPRO™ Ruby (Bio-Rad) stain was used as a loading control. Representative images from one of three independent experiments are shown. Western blot data are cut for visualization purposes, and all samples for the respective antibody were analyzed on the same blot. PGRN: progranulin, IL: interleukin. The uncropped bolts are shown in Supplementary Materials. Image collected and cropped by CiteAb from the following open publication (https://www.mdpi.com/2072-6694/15/24/5757), licensed under a CC-BY license. Not internally tested by R&D Systems.Applications for Human Progranulin/PGRN Antibody
Immunohistochemistry
Sample: Immersion fixed paraffin-embedded sections of human breast cancer tissue
Knockout Validated
Western Blot
Sample: HepG2 human hepatocellular carcinoma cell line
Reviewed Applications
Read 4 reviews rated 4 using AF2420 in the following applications:
Formulation, Preparation, and Storage
Purification
Reconstitution
Reconstitute at 0.2 mg/mL in sterile PBS. For liquid material, refer to CoA for concentration.
Formulation
Shipping
Stability & Storage
- 12 months from date of receipt, -20 to -70 °C as supplied.
- 1 month, 2 to 8 °C under sterile conditions after reconstitution.
- 6 months, -20 to -70 °C under sterile conditions after reconstitution.
Calculators
Background: Progranulin/PGRN
References
- Plowman, G.D. et al. (1992) J. Biol. Chem. 267:13073.
- Zhou, J. et al. (1993) J. Biol. Chem. 268:10863.
- Liu, Y. et al. (2007) BMC Cancer 7:22.
- Xu, K. et al. (2007) J. Biol. Chem. 282:11347.
- Davidson, B. et al. (2004) Cancer 100:2139.
- Zanocco-Marani, T. et al. (1999) Cancer Res. 59:5331.
- Lu, R. and G. Serrero (2000) Proc. Natl. Acad. Sci. USA 97:3993.
- Sun, X. et al. (2004) Am. J. Respir. Cell Mol. Biol. 30:510.
- Barreda, D.R. et al. (2004) Dev. Comp. Immunol. 28:727.
- Justen, H.P. et al. (2000) Mol. Cell Biol. Res. Commun. 3:165.
- Suzuki, M. and M. Nishiahara (2002) Mol. Genet. Metab. 75:31.
- He, Z. et al. (2003) Nat. Med. 9:225.
- Zhu, J. et al. (2002) Cell 111:867.
- He, Z. and A. Bateman (2003) J. Mol. Med. 81:600.
- Bateman, A. et al. (1990) Biochem. Biophys. Res. Commun. 173:1161.
- Gonzalez, E.M. et al. (2003) J. Biol. Chem. 278:38113.
- Jones, M.B. et al. (2003) Gynecol. Oncol. 88:S136.
- Wang, W. et al. (2003) Clin. Cancer Res. 9:2221.
- Zhang, H. and G. Serrero (1998) Proc. Natl. Acad. Sci. USA 95:14202.
- Baker, M. et al. (2006) Nature 442:916.
Alternate Names
Gene Symbol
UniProt
Additional Progranulin/PGRN Products
Product Documents for Human Progranulin/PGRN Antibody
Certificate of Analysis
To download a Certificate of Analysis, please enter a lot or batch number in the search box below.
Note: Certificate of Analysis not available for kit components.
Product Specific Notices for Human Progranulin/PGRN Antibody
For research use only
Related Research Areas
Citations for Human Progranulin/PGRN Antibody
 Powered by Bioz
Customer Reviews for Human Progranulin/PGRN Antibody (4)
Have you used Human Progranulin/PGRN Antibody?
Submit a review and receive an Amazon gift card!
$25/€18/£15/$25CAN/¥2500 Yen for a review with an image
$10/€7/£6/$10CAN/¥1110 Yen for a review without an image
Submit a review
Customer Images
-
Application: Western BlotSample Tested: Colon tissueSpecies: MouseVerified Customer | Posted 10/01/2024

-
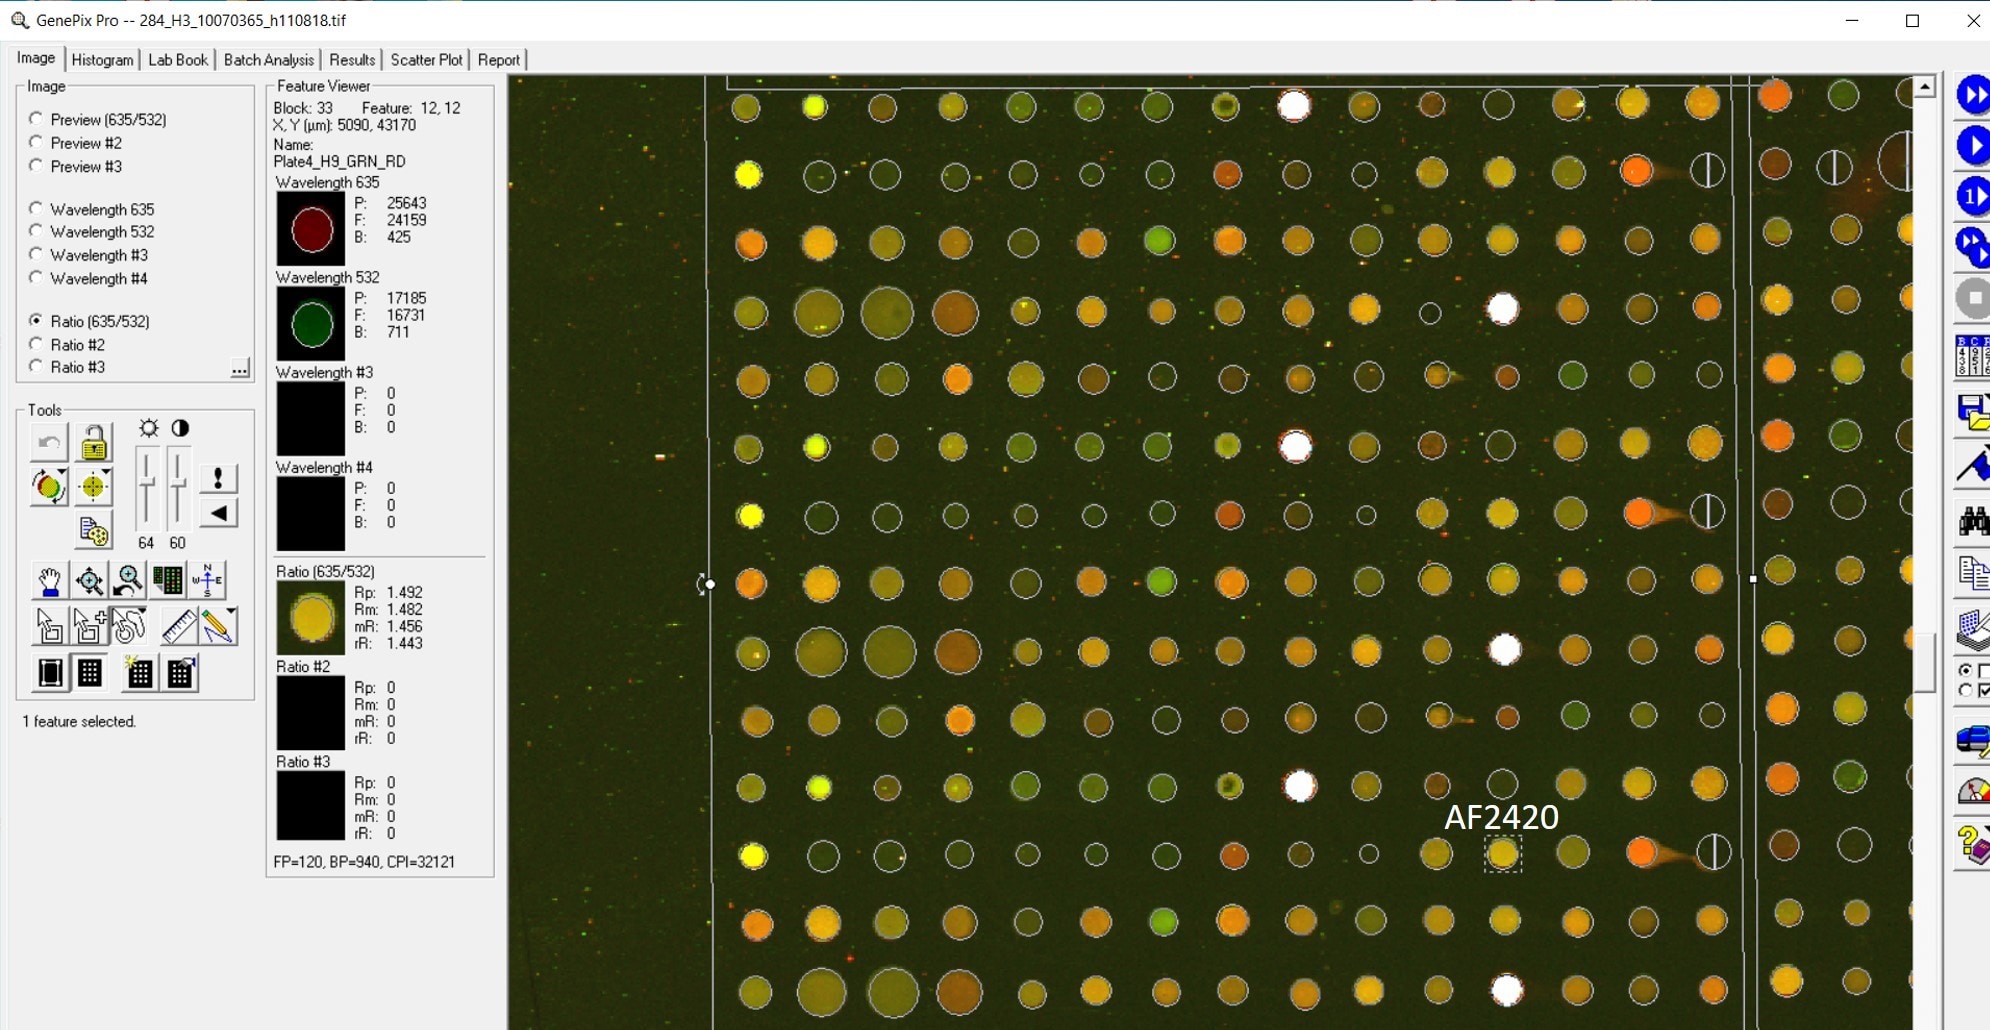
Application: MicroarraysSample Tested: EDTA PlasmaSpecies: HumanVerified Customer | Posted 01/14/2021
-
Application: MicroarraysSample Tested: EDTA PlasmaSpecies: HumanVerified Customer | Posted 11/07/2018
-
Application: MicroarraySample Tested: EDTA PlasmaSpecies: HumanVerified Customer | Posted 10/31/2018
There are no reviews that match your criteria.
Protocols
Find general support by application which include: protocols, troubleshooting, illustrated assays, videos and webinars.
- Antigen Retrieval Protocol (PIER)
- Antigen Retrieval for Frozen Sections Protocol
- Appropriate Fixation of IHC/ICC Samples
- Cellular Response to Hypoxia Protocols
- Chromogenic IHC Staining of Formalin-Fixed Paraffin-Embedded (FFPE) Tissue Protocol
- Chromogenic Immunohistochemistry Staining of Frozen Tissue
- ClariTSA™ Fluorophore Kits
- Detection & Visualization of Antibody Binding
- Fluorescent IHC Staining of Frozen Tissue Protocol
- Graphic Protocol for Heat-induced Epitope Retrieval
- Graphic Protocol for the Preparation and Fluorescent IHC Staining of Frozen Tissue Sections
- Graphic Protocol for the Preparation and Fluorescent IHC Staining of Paraffin-embedded Tissue Sections
- Graphic Protocol for the Preparation of Gelatin-coated Slides for Histological Tissue Sections
- IHC Sample Preparation (Frozen sections vs Paraffin)
- Immunofluorescent IHC Staining of Formalin-Fixed Paraffin-Embedded (FFPE) Tissue Protocol
- Immunohistochemistry (IHC) and Immunocytochemistry (ICC) Protocols
- Immunohistochemistry Frozen Troubleshooting
- Immunohistochemistry Paraffin Troubleshooting
- Preparing Samples for IHC/ICC Experiments
- Preventing Non-Specific Staining (Non-Specific Binding)
- Primary Antibody Selection & Optimization
- Protocol for Heat-Induced Epitope Retrieval (HIER)
- Protocol for Making a 4% Formaldehyde Solution in PBS
- Protocol for VisUCyte™ HRP Polymer Detection Reagent
- Protocol for the Preparation & Fixation of Cells on Coverslips
- Protocol for the Preparation and Chromogenic IHC Staining of Frozen Tissue Sections
- Protocol for the Preparation and Chromogenic IHC Staining of Frozen Tissue Sections - Graphic
- Protocol for the Preparation and Chromogenic IHC Staining of Paraffin-embedded Tissue Sections
- Protocol for the Preparation and Chromogenic IHC Staining of Paraffin-embedded Tissue Sections - Graphic
- Protocol for the Preparation and Fluorescent IHC Staining of Frozen Tissue Sections
- Protocol for the Preparation and Fluorescent IHC Staining of Paraffin-embedded Tissue Sections
- Protocol for the Preparation of Gelatin-coated Slides for Histological Tissue Sections
- R&D Systems Quality Control Western Blot Protocol
- TUNEL and Active Caspase-3 Detection by IHC/ICC Protocol
- The Importance of IHC/ICC Controls
- Troubleshooting Guide: Immunohistochemistry
- Troubleshooting Guide: Western Blot Figures
- Western Blot Conditions
- Western Blot Protocol
- Western Blot Protocol for Cell Lysates
- Western Blot Troubleshooting
- Western Blot Troubleshooting Guide
- View all Protocols, Troubleshooting, Illustrated assays and Webinars